
Odoo Reporting
Odoo reporting and analytics: track your KPIs efficiently!
Want a real-time view of the actual state of your business? Are you tired of expensive and complex BI tools? Odoo offers easy-to-use and powerful reporting tools that give you all the information you need in one place!
With Odoo, you can do away with expensive standalone software and the cumbersome integrations that come with it. When you manage your business with Odoo, all the data you need for reporting and the resulting graphs and analyses are always available in one system, without the need for data migration and separate system integrations.
When you add data to Odoo, it updates directly to reports, graphs and dashboards without any separate synchronisation. The pre-built standard reports built into Odoo can be customized to meet your needs. If standard reports are not enough, we can help you build custom reports.
Odoo's reporting views:
With Odoo reports, you can easily customise data to your needs
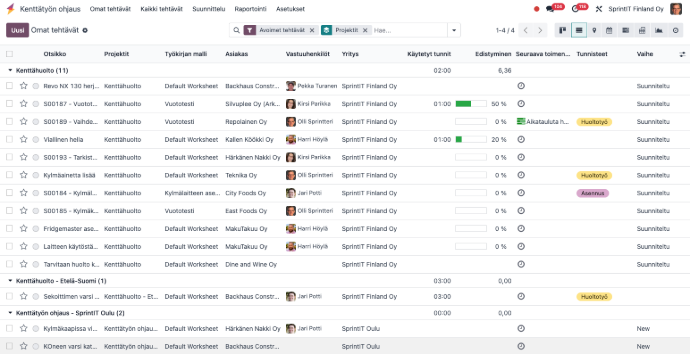
List view:
Easily view data and customize views by filtering, sorting and grouping data exactly the way you want. In Odoo you will find a large number of standard views to help you visualise, for example, the status of a sales pipeline or the turnover rate of an inventory.
Pivot tables help you analyse your data:
Versatile pivot tables allow you to analyse and summarise your data. You can create detailed summary views and identify trends or anomalies effectively. In Odoo, you can drill down deeper into the figures in a report to see directly what events make up the data.

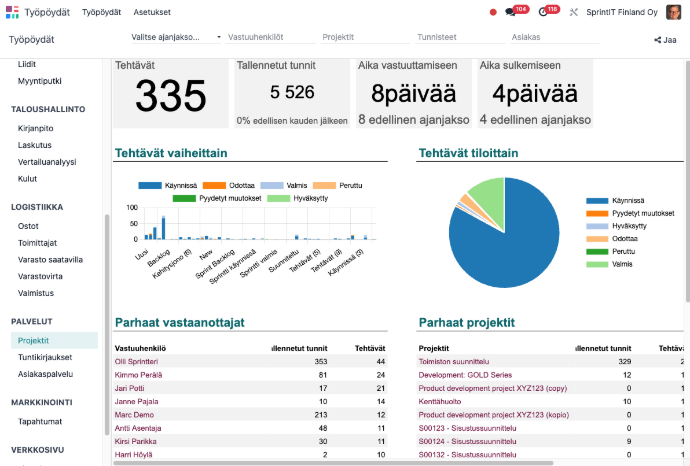
Dashboards:
Customizable dashboards bring together in one view the key KPIs that allow you to monitor your business performance in real time. Dashboards are easy to build with the Spreadsheet feature in Odoo.
Spreadsheet tool:
Spreadsheet software built into Odoo. Odoo's own cloud-based spreadsheet integrates seamlessly with your company's data in Odoo. You can perform calculations and analyses in real time, using familiar Excel formulas. Odoo Spreadsheets is particularly useful for project management, sales, production and financial management.
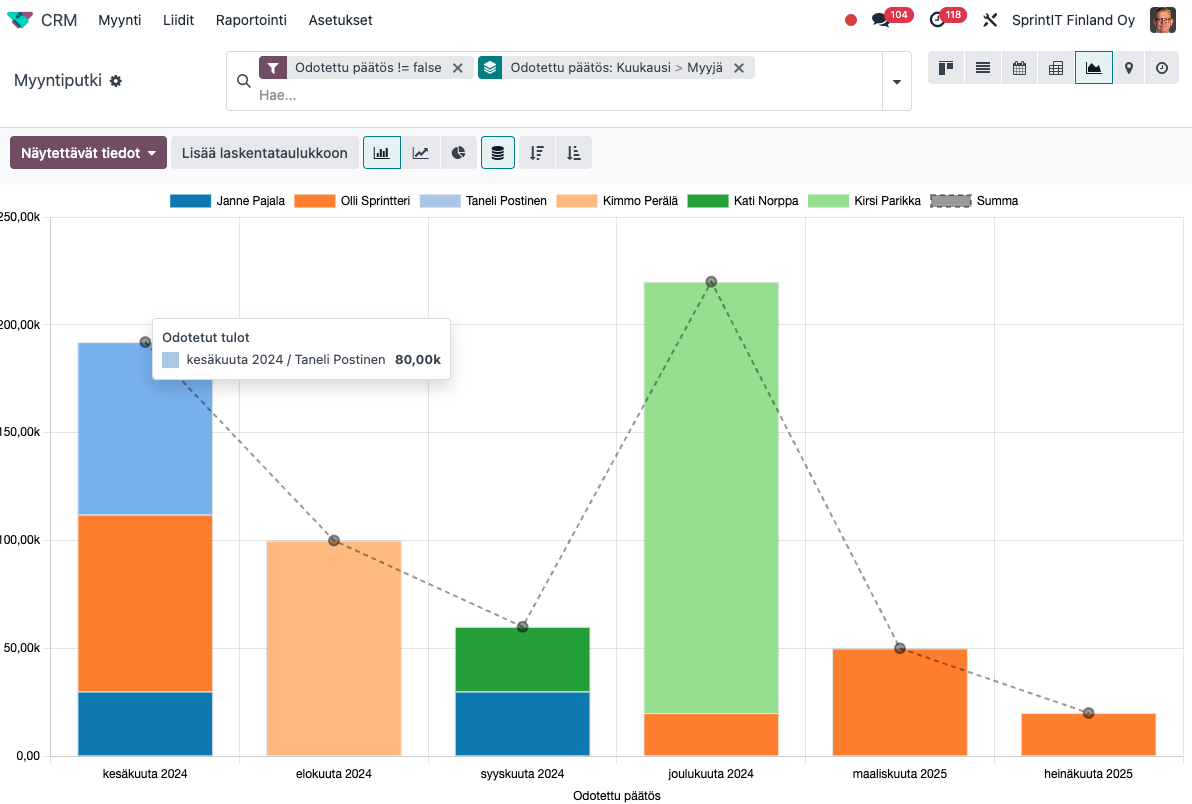
Graphs:
Visual tools such as bar, line and pie charts help to present data clearly.
Data quality and development needs - Odoo Data Cleaning Module:
Odoo provides impressive reporting tools, but the quality and cleanliness of the master data is absolutely critical. Odoo's own Data Cleaning Module ensures that all your data is accurate and up-to-date. Our Data Quality Management module developed for Odoo will alert you if there are any gaps or errors in your data.
At SprintIT, we have particularly strong expertise in data processing. Take advantage of our expertise already during the implementation phase of Odoo.
Odoo provides reports in real time
Odoo shows everything in real time. Data is automatically updated in reports without any delays. You can always be confident that the information available is up-to-date and accurate. With information in one place, you no longer spend hours editing reports and gathering data from different sources.
Odoo optimises processes
Odoo's reporting features are not limited to superficial views. You can drill deeper and analyse detailed data. This enables you to review production costs, analyse sales and monitor your financial management effectively. In addition, all data is accompanied by a chat function that allows you to easily ask a colleague or customer for more information on a specific topic.
Odoo adapts to your specific reporting needs
With Odoo, you can dispense with many standalone systems, as Odoo includes more than 80 modules for different purposes. You can compile the information you need from the different modules into reports.
Odoo can also be integrated with other software if required. This makes Odoo an excellent choice for companies that need flexible and easily customizable reporting solutions.
Interested in reporting? Check out our blog for more examples and information about Odoo reporting features. You can also read how Odoo meets the reporting needs of different departments in your company, such as finance and management.

Let's work together to design a solution that suits your need!
Frequently asked questions about Reporting
What reporting tools does Odoo offer?
Odoo offers a wide range of reporting tools, including a rich set of standard reports, customizable dashboards and Odoo Spreadsheets. Data can be displayed in list views, pivot tables and different types of graphs.
Can I create my own report views in Odoo?
Yes, in Odoo you can create your own report views and dashboards. Define filters for reporting views and group the data according to your own goals and needs.
How does Odoo integrate with other BI tools?
Odoo integrates with several BI tools through API interfaces. You can export data from Odoo to a BI tool for analysis and visualization. In most cases, however, you will not need a separate BI tool, as Odoo has very rich and flexible reporting capabilities.
What are the benefits of the Odoo Spreadsheet tool?
The Spreadsheet tool is a cloud-based spreadsheet that integrates in real-time with your Odoo data. All information in the reports is always available in real time. You can use Odoo Spreadsheets for budgeting, forecasting, ad-hoc analysis, etc.
How does Odoo support budgeting?
Odoo has a dedicated budgeting module that allows you to create and monitor budgets. You can define budget periods, budget rows and budgeted amounts.
How can I ensure the quality of my financial data in Odoo?
To ensure the quality of your financial data, it is important to ensure that all entries and related supporting documents are correctly recorded and that the accounts are properly closed. Odoo offers a number of tools for data verification and correction, as well as automatic data entry.
How can I get help with Odoo reporting?
SprintIT offers consulting, training and support services for using Odoo reporting. Please contact us, we are happy to help!